
Canada’s East Coast ports’ cargo movements in container traffic grew in 2018 but lagged slightly behind their U.S. counterparts as well as those along the Gulf of Mexico, statistics show.
However, when it comes to energy products, Canada is growing but not as fast as the U.S., where an oil and gas boom continues to fuel growth, particularly at the Texas port of Corpus Christi.
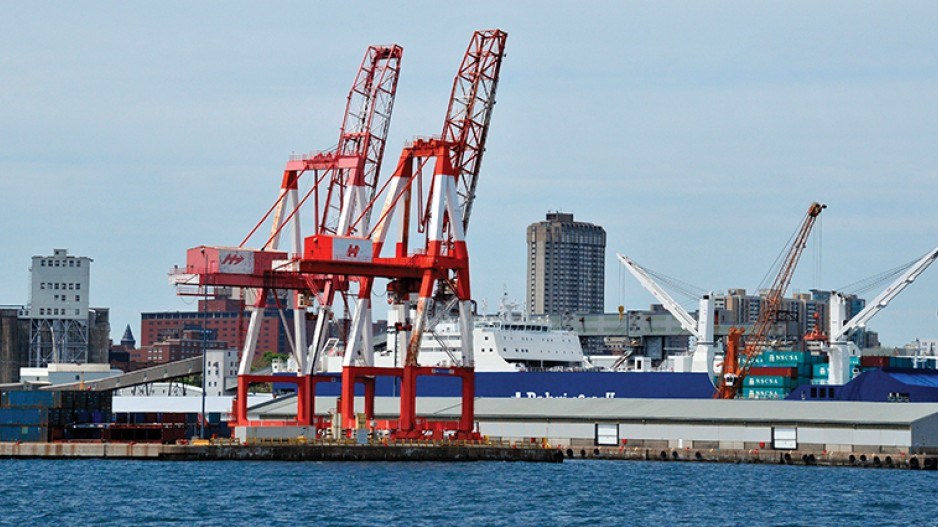
Halifax experienced a decrease in container traffic of 20-foot-equivalent units (TEUs) to 547,445 in 2018, from 559,242 in 2017, a 2.1% decline. The port’s total tonnage also declined 4.8% to 4.77 million metric tonnes (MMT) in 2018, from 5.01 MMT in 2017.
Spokesman Lane Farguson said the Halifax Port Authority doesn’t release detailed cargo information beyond what is on its website.
Hamilton saw increases in traffic of steel, agricultural and liquids while aggregates declined.
Agricultural products realized the biggest increase, jumping 53% to 3.51 MMT in 2018, from 2.29 in 2017. Liquid products were close behind with a jump of 47% to 405,126 tonnes in 2018 from 275,760 in 2017. Far behind but still rising were steel products with an increase of 4.5%, with 7.19 MMT moving in 2018 compared with 6,796,301 in 2017. Aggregates, however, declined 7% to 281,567 tonnes from 304,377.
Montreal handled 1,679,351 TEUs in 2018, compared with 1,537,669 in 2017, an increase of 8.4%.
That, in part, reflects a total tonnage change of 38,925 tonnes compared with 38,041, a rise of 2.32%.
Montreal’s non-containerized iron and steel cargo increased 47.63% to 24,630 tonnes from 16,630; grains decreased 4.31% to 1,056 tonnes from 1,103; vehicles and accessories increased 120.11% to 1,204 tonnes from 547; forest products rose 10.22% to 2.4 MMT from 2.1; chemical products rose 6.79% to 380,881 tonnes from 356,676; and liquid bulk including crude oil, gasoline fuel oil, diesel oil and jet fuel among others rose 11.69% to 16.37 MMT from 14.66.
Thunder Bay experienced a slight overall decline in cargo in 2018, a 0.9% drop to 8.7 MMT from 8.8 MMT in 2017.
Among cargo categories, grain increased 1.7% to 7.4 MMT in 2018 from 7.27 MMT in 2017 – a decline from a high of 8.3 MMT in 2018 in 2014. Coal fell 2.6% to 702,695 tonnes from 721,751 tonnes, and from 2016’s total of 778,419 tonnes. Potash dropped 19% to 425,859 tonnes in 2018 from 526,895 tonnes in 2017, but still posted an increase over 2013-16. Dry bulk dropped 33% to 137,910 tonnes from a six-year high in 2017 of 207,102 tonnes; liquid bulk fell 37.7% to 35,485 in 2018 from 57,034 tonnes in 2017. Both years were down from 2016’s 62,009 tonnes, a threefold increase over 2015.
The Port of New York and New Jersey moved 7,179,792 TEUs, a 13.8% increase compared with the 6,710,817 in 2017. It was a third year of increases, with 2005 seeing a 7.3% rise and 2015 showing a 12.2% jump.
The Port of Virginia posted little change in TEU movements. It moved 1,612,886 TEUs in 2018 compared with 1,612,760 in 2017, a 0.01% increase.
In tonnage, 21,785,434 short tons (2,000 pounds) of TEU cargo moved in 2018 compared with 21,784,594 in 2017, an almost negligible shift.
Break bulk increased to 189,429 short tons from 187,124, an increase of 1.2% but a continued shift away from declines of 8.5% and 30.9% in 2017 and 2016.
TEU movements at Houston were up 10.3% to 2,228,017 in 2018 from 2,019,259 in 2017. That was on top of a jump of 11.5% between 2016 and 2017.
South Carolina Ports Authority reported 6.4% year-over-year container volume growth, with a record 2.3 million TEUs handled in 2018.
Savannah moved 4.35 million TEUs in 2018, its highest-ever annual volume and a 7.5% increase over 2017.
In Corpus Christi, petroleum and gas products remained a large part of 2018 cargoes.
Petroleum handling rose to 47,495,263 short tons in 2018 from 41,643,427 in 2017, a 14% increase; crude-oil handling increased to 45,665,010 short tons in 2018 from 41,643,427 in 2017, a shift of 9.6%.
Break bulk amounted to 555,720 short tons in 2017, rising to 621,285 in 2018, a shift of 11.7%.
Dry bulk was 7,114,556 short tons in 2017, falling to 6,954,203 in 2018, a drop of 2%.
Bulk grain handling didn’t fare as well as other products, plunging 98% from 5.15 million short tons in 2017 to 2.6 million short tons in 2018. And liquid bulk declined 2.6% to 514,887 short tons in 2018 from 528,900 in 2017.
Detailed statistics for Miami were unavailable despite requests.


