
Metro Vancouver workers ride transit more and have a wider range of incomes than those in many other West Coast cities, according to data compiled by Bing Thom Architects.
Bing Thom planner Andy Yan and principal Michael Heeney created the ridership portrait using Statistics Canada’s 2011 National Household Survey and the 2011 American Communities Survey. They’re using the results of their analysis to support the yes side in Metro Vancouver’s ongoing transit tax plebiscite.
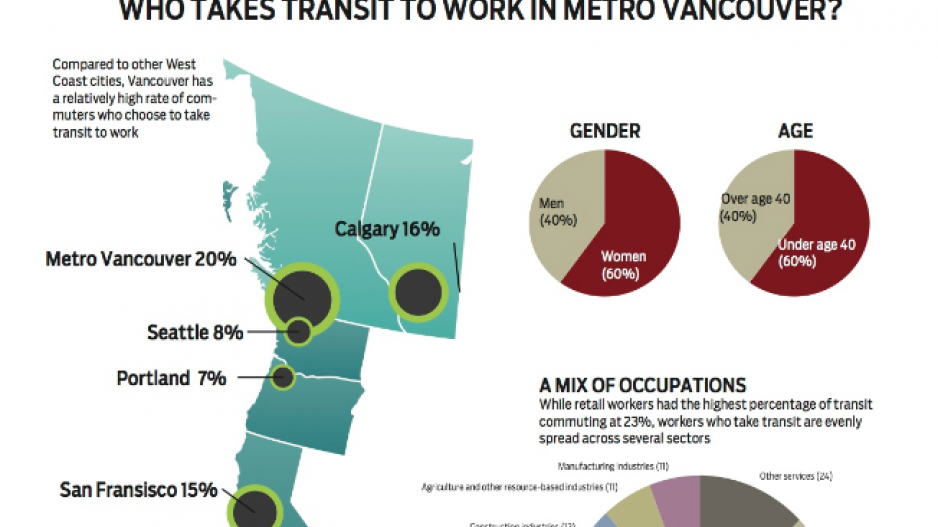
According to the data, a higher percentage of workers — 20% — take transit to work in Metro Vancouver than other major West Coast cities; the next-highest city was Calgary, at 16%.
“We’re total leaders on the West Coast. Now we’re not [when compared with] New York City, which is 40%,” Yan said.
“But at 20% you’re light years ahead of Calgary, Seattle, Portland, San Francisco and Los Angeles.”
Women and young people represented the highest proportion of transit riders: 60% of workers who commuted via transit were women and 60% were under the age of 40.
While it wasn’t surprising that people with lower incomes were more likely to take the bus, Vancouver transit commuters had a wider range of incomes and occupations than many American cities, Yan said.
“The good news is that there’s actually a decent mix in transit [users’ incomes],” Yan said.
“If you look at transit systems in L.A., they’re almost completely dominated by low-end service workers.”
The data project follows efforts by other transportation professionals to highlight the successes of the region’s transit system during a campaign that has been dominated by the portrayal of TransLink as mismanaged and wasteful.
Polls have repeatedly shown that TransLink’s reputation is a major stumbling block for the yes side. Politicians on the yes side have scrambled to prove to voters that money raised through the proposed 0.5% regional sales tax will be used responsibly, announcing a new CEO for TransLink just one month before voting started and appointing Jim Pattison, one of B.C.’s most well-known business figures, to head an accountability committee.
In February, Todd Litman, a Victoria-based transportation planner, published a comparison of several transit authorities showing that TransLink performs well on measures like ridership, farebox recovery and operating costs.
![]()
![]()
Source: Todd Litman, Eleven Reasons to Support Vancouver's Transportation Tax
Transportation planning staff at the City of Vancouver have been giving public presentations which have emphasized the region’s relatively high transit ridership compared to other North American cities.
But Jordan Bateman, the leader of the no side, said he wasn’t convinced, calling Litman’s data “made-up numbers.” Referring to the discontinued long-form census, he called Yan’s data “numbers that some architect has plucked out of a census that all the architects have been criticizing because they don’t get all the data they want anymore.”
Bateman said the only numbers he trusts are from TransLink’s own trip diary survey, which showed transit mode share at 14% in 2011.
Litman said he stood by his calculations, which are based on comparisons of similar measures, such as revenue per passenger, from several transit authorities, collected by the Canadian Urban Transit Association.
“There is always the possibility that we made errors, but we did our best,” wrote Litman in an email to BIV. “Jordan [is] welcome to check our calculations.”
@jenstden


