
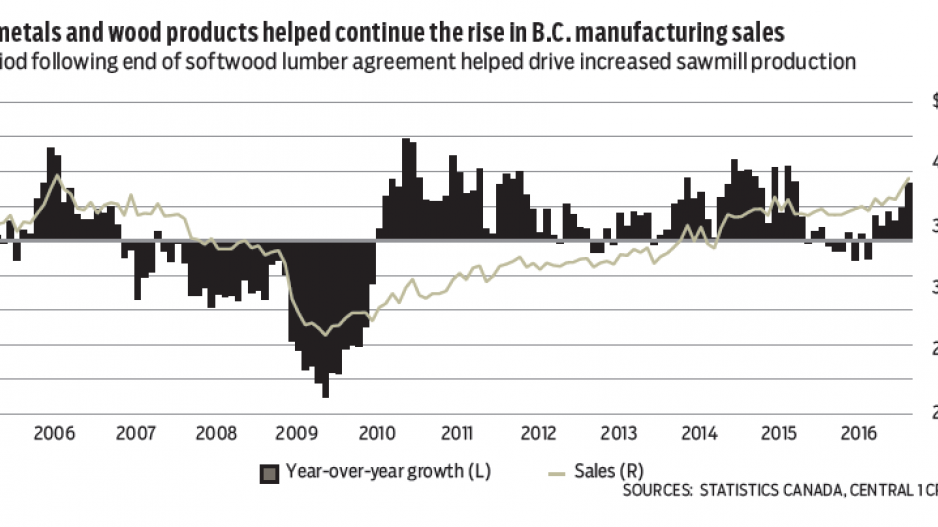
August was a stellar month for B.C. manufacturing momentum. Following a 2.4% increase in July, shipments jumped again in August by 2.1% to push sales to a seasonally adjusted $3.89 billion. Year-over-year shipments rose 8.1% from a year ago. B.C. exceeded a national gain of 0.9% during the month and a year-over-year drop of 1%. Commodity-related declines in Alberta and Newfoundland and Labrador, and transportation-related weakness in Quebec, were key contributors to the year-over-year national decline.
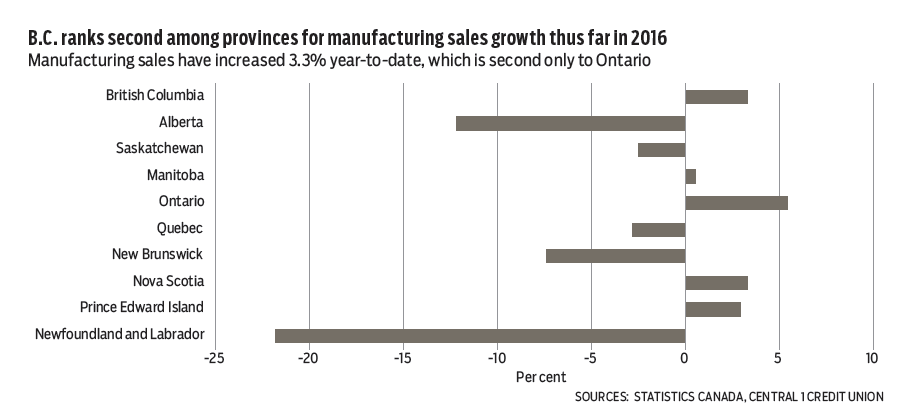
Year-to-date, B.C. sales climbed 3.3%, second only to Ontario. Key B.C. drivers included a 33% increase in primary metals and a 12% rise for wood products. Combined with food-related production, these sectors effectively drove all manufacturing gains from a year ago. In contrast, paper manufacturing sales fell 7.5% and were a key offset. The province’s manufacturing sector is benefiting from a positive environment for exports – namely a competitive exchange rate, mild expansion in the U.S. economy and, up until this month, the one-year grace period following the end of the expired softwood lumber agreement that allowed free exports to the U.S. There was a 5% increase in B.C. sawmill production through July, with physical export growth of 14% through August, mostly to the U.S.
While a competitive exchange rate and improving U.S. economy will underpin demand for B.C. manufacturing products, wood products are a risk to growth. Tariffs are likely in the months ahead.
Tourism activity in B.C. remained rock-solid in August. International tourist inflows remained consistent with July, easing by 0.2% to a seasonally adjusted 448,400 tourists. Visits by U.S. residents, after declining from a March peak (boosted by the World Rugby Sevens Series), have stabilized since June and trend at mid-2000 levels. Meanwhile the number of overseas visits fell 1.5% from July but remained near record highs.
Despite deceleration from earlier this year, a year-to-date gain of 11.5% underscores this year’s economic contribution from tourism. Year-to-date visits from the U.S. were up 10%, with a near 14% gain from overseas markets. China inflows climbed 16%, South Korea 15% and Taiwan 30%. Meanwhile, visits from Mexico and Australia rose 30% and 13%, respectively. A competitive Canadian dollar, rising demand for overseas travel and the perceived safety of Canada have likely all contributed to gains and should help elevate inflows over the next two years. •
Bryan Yu is senior economist at Central 1 Credit Union.


