It's still too early to say if the Lower Mainland’s housing-price correction is over, but February data points in that direction.
While sales fell a whopping 42% year-over-year, market conditions were stronger than this suggests. February sales were comparable to a strong year-ago performance, which culminated in a record-high spring pace that ultimately yielded to below-average activity by year’s end. While soft, February sales were in line with levels observed since the fall: a subdued pace consistent with 2014 levels, but hardly a crash.
Meanwhile, prices firmed.
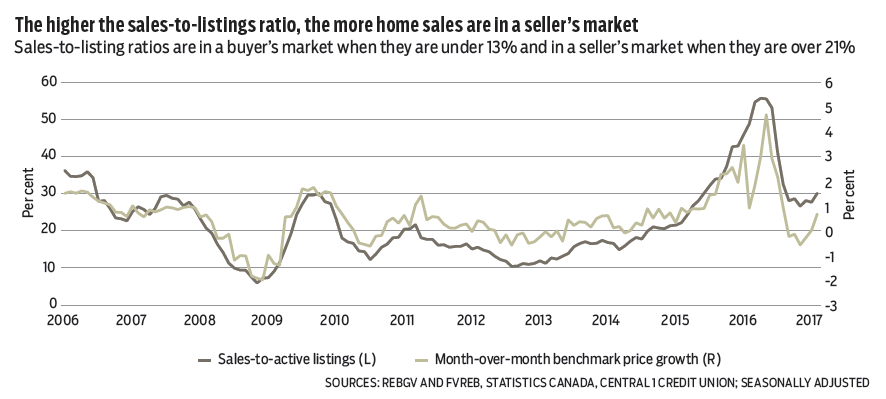
While we do not emphasize average values given volatility, a 10% gain from January to $863,740 suggests positive momentum. More telling was composite Multiple Listing Service benchmark price growth from January of 1%, driven by acceleration in townhome and apartment prices, with detached-home prices unchanged. Year-over-year benchmark price growth of 16% compares with a 10% average price drop.
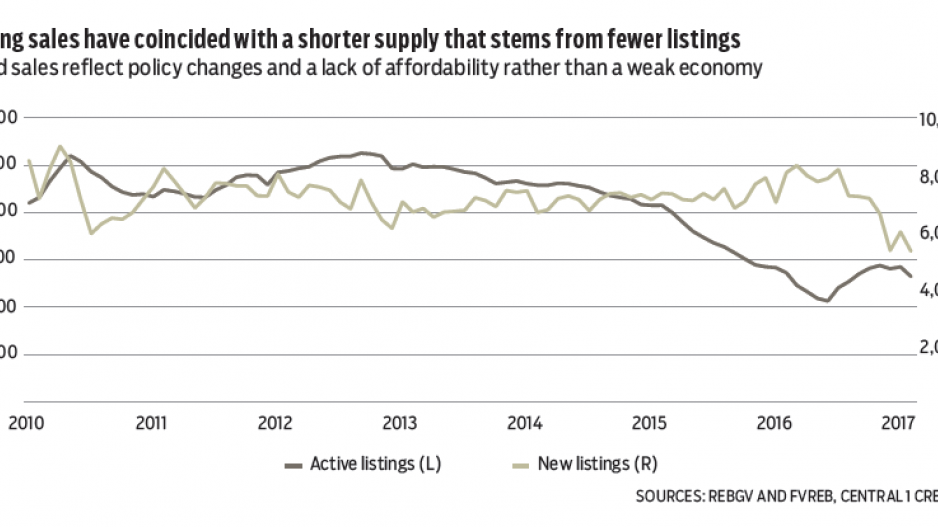
Inventory shortages are supporting prices after a cumulative benchmark price decline of less than 4%. Adjusted for seasonality, both new home listings and active listings declined, contributing to seller’s-market conditions, particularly for townhomes and apartments.
Housing supply is expected to remain tight. Subdued sales reflect policy changes and affordability, not a deteriorating economy, meaning sellers are in a position to be patient or delay sales.
Owner-buyers also face a lack of available properties to upgrade to, creating a low--inventory cycle. Short of a flood of new housing completions and vacant units in a short period or a severe recession that cuts jobs, prices are likely to hold stable.
Following a commodity--sector pullback, non-residential capital expenditures in B.C. partly rebounded in 2016 and look set to increase this year.
Estimated capital expenditures climbed 4.8% in 2016 to $27.6 billion after an 8% decline in 2015. Despite the increase, capital spending remained in line with the range observed since 2010 but was below 2014 levels in both nominal and inflation-adjusted terms. Among industries, capital investment was driven by a few select sectors, particularly public administration.
Finance and insurance, real estate, utilities and non-energy mining helped boost overall spending.
Statistics Canada’s survey points to a mild uplift in capital spending driven by public-sector spending in 2017 of 3.4%.•

Bryan Yu is senior economist at Central 1 Credit Union.


