
Revenue for B.C.’s 20 largest casinos grew an average of 20% between 2012 and 2016.
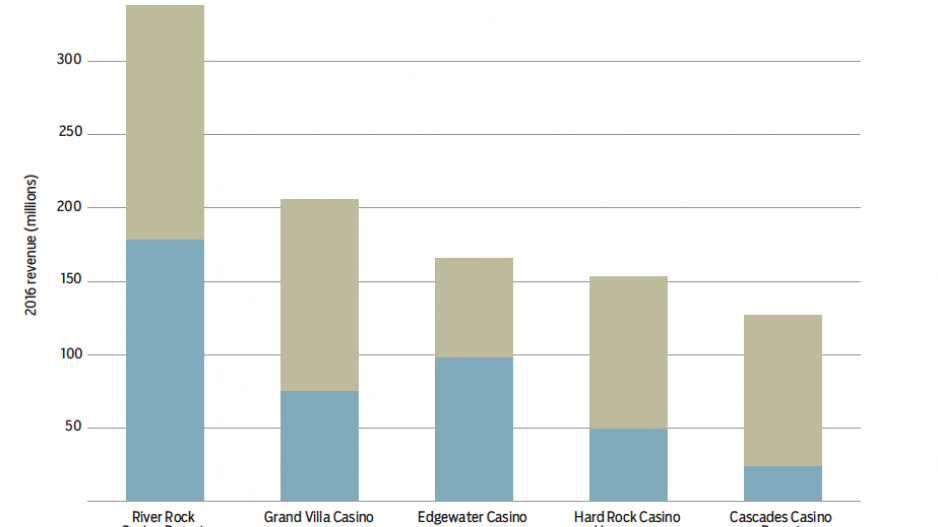
The top five, based on Business in Vancouver’s Biggest Casinos and Bingo Halls in B.C. list (see page 20), averaged a similar revenue growth rate of 20.3% over the same period. The growth resulted primarily from higher table game revenue, which has increased an average of 38% since 2012.
While table game revenue growth was strong over most of the five-year period, it slowed to 0.5% from 2015 to 2016.
In comparison, slot machine revenue has posted more consistent growth across the industry. It grew by an average of 11.9% from 2012 to 2016. The Hard Rock Casino Vancouver was the only casino in the top five to report a decline (0.17%) in slot machine revenue over the five-year period. However, the casino’s total revenue grew by 9.8% over the same period.
River Rock Casino Resort’s slot machine revenue rose by 18.7%, climbing to $158.7 million in 2016 from $133.7 million in 2012. Over the same period, the casino’s slot machine revenue as a proportion of total revenue rose to 47% from 42.4%.
Although River Rock Casino Resort had the largest slot machine revenue increase in the province, it also had the largest one-year drop in table game revenue, falling 15.9% or $33.8 million in 2016 from 2015.
Among the five largest casinos in the province, revenue per gaming table increased 41.1% between 2012 and 2016 compared with an average increase of 6.4% in revenue per slot machine during the same period.
The lower earnings associated with slot machines prompted the five largest casinos to increase their number of slot machines at more than twice the rate by which they raised the number of table games over the five-year period.
Average revenue per gaming table at the top five B.C. casinos rose to $1.2 million in 2016 from $941,900 in 2012.
Revenue from slot machines rose to an average of $119,340 per machine in 2016 from $111,900 in 2012. •


