

In one fell swoop, U.S. corporate tax cuts helped send a measure of Greater Vancouver tax competitiveness down to the bottom of a pack of 17 comparable jurisdictions worldwide.
Research in the second regional economic scorecard from the Greater Vancouver Board of Trade (GVBOT) and The Conference Board of Canada shows that the region is now home to the worst marginal effective tax rate among the group of cities studied.
“When we did this two years ago, we were ranked 10. We’re last now," said Iain Black, GVBOT president and CEO, who added the ranking change has him "really, really worried."
The rate looks at the rate of return from a new investment, and measures how much of it is needed to pay all capital-related taxes. All else held equal: the higher the proportion, the lower the overall rate of return. And this year, Greater Vancouver’s marginal effective tax rate sits nine percentage points higher than the rate in Seattle, Portland and other U.S. counterparts.
“This is a big deal," said Black, who shared a slide at the GVBOT's scorecard launch event on May 10 that placed tax competitiveness at the top of the board's list of policy priority areas. “We have a competitiveness issue in this country, and in this region, we’re showing it in spades."
The Greater Vancouver Economic Scorecard 2018 builds on the first such scorecard published two years ago. (Continued below)
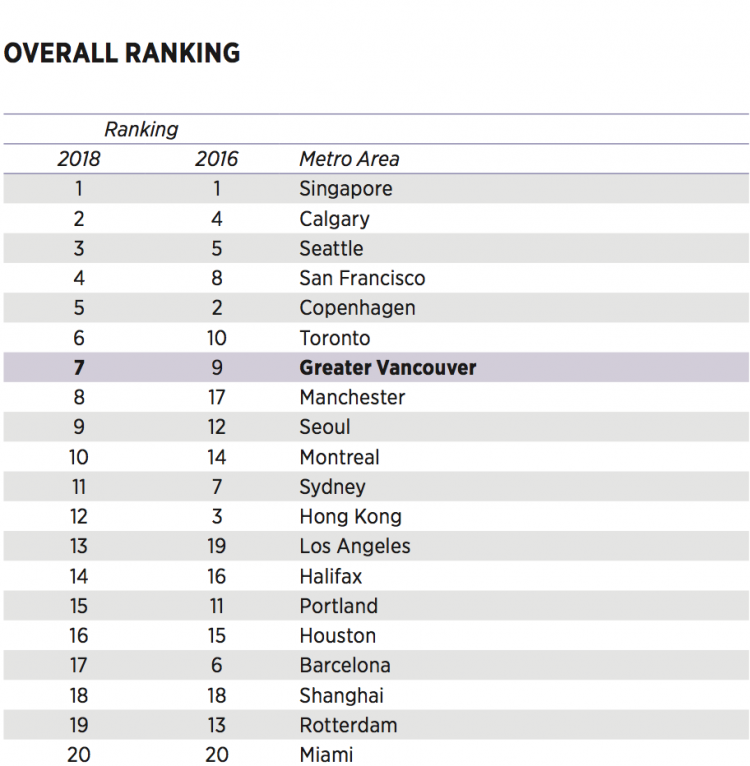
This year’s report shows Greater Vancouver rose two spots in the scorecard’s rankings of 20 jurisdictions around the world, which include five Canadian regions and six in the U.S. It examined 38 economic and social indicators to benchmark Greater Vancouver’s competitiveness and attractiveness, with grades A through D awarded based on a region’s position on the list.
Greater Vancouver maintained its B grade from 2016 to 2018, but fell from seventh to eighth place on the social-focused scale, weighed down by challenges tied to housing affordability, transportation and retaining a young working population.
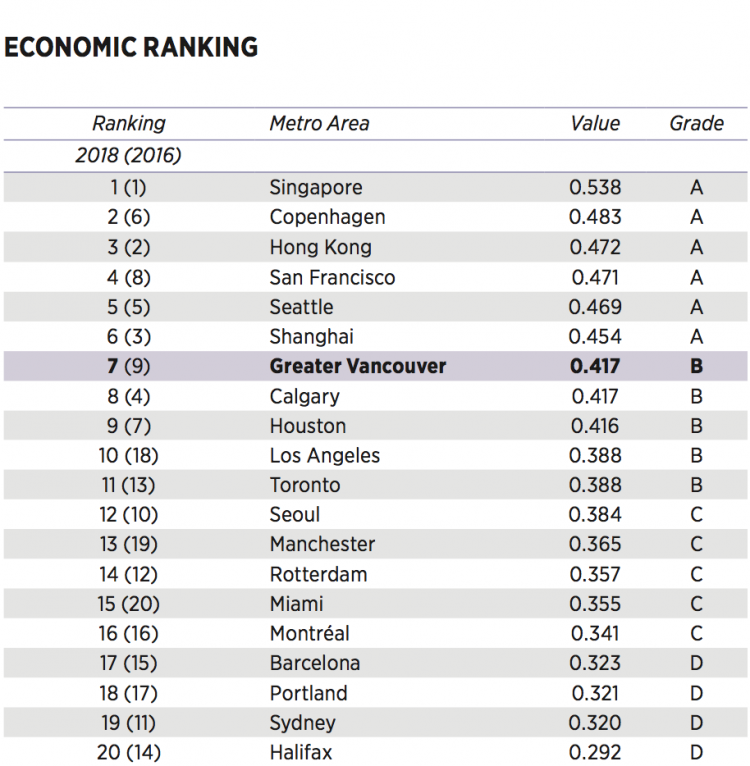
At the big picture level, little changed in Greater Vancouver’s overall economic ranking, measured by 22 indicators, such as the costs of doing business, venture capital investment, market size and labour productivity. Overall, the region’s standing improved in nine, worsened in as many and held pat in three; the remaining category was new.
But the devil hides in the details. (Continued below)
The region held on to its two grade-A marks for office rents and on KPMG’s total tax index.
On the former, the region ranks sixth out of 18 areas, at US$40 per square foot. Hong Kong – the list’s most expensive market – captures US$300 per square foot. While a lower cost may have benefits, the report suggests that comparatively lower prices indicate weaker demand for office space, particularly from companies searching for headquarter space.
However, the data does not account for a recent run-up in office space costs. Neither does Greater Vancouver’s other grade-A mark – on KPMG’s total tax index – account for recent U.S. corporate tax changes.
Report to report, the region’s marks for unemployment, venture capital investment and inbound airplane seats per capita rose from C grades to Bs.
In five instances, the region’s grades slumped.
In employment growth, Greater Vancouver fell from twelfth to thirteenth out of the 20 areas studied, pulling its grade down from a C to a B.
The region’s grades for marginal effective tax rate and after-tax income per capita fell from C to D. Two international indicators courted the same decline: the number of international visitors, and the number of participants at international association meetings.
“Vancouver has been on a tear, we’ve been growing quite aggressively and it's terrific,” said Daniel Muzyka, immediate past president and CEO of The Conference Board of Canada.
“The bad news is, the throttle is coming off,” he said, adding that immigration, nurturing the region’s high-tech sector and successfully developing its federally funded supercluster will help sustain growth.
The elephant in the room, he says, is real estate.
“What’s happened in real estate is completely unsustainable. It is a huge detractor for us going forward. The question is, how do we transition from almost an addiction to real estate?”
Scorecard 2018 dedicated a special focus to regional governance and collaboration.
Of eight Canadian and American jurisdictions – including Portland, Toronto and Calgary – Greater Vancouver placed second, behind Seattle-Tacoma. The report concluded a number of priorities could help the region’s near two-dozen municipalities work better together on issues as complex as housing and transportation. Among them: centralizing economic development and investment promotion, and directly electing Metro Vancouver’s board.
Four other Canadian cities were graded in the report. At seventh overall, Greater Vancouver ranked below Calgary (second place) and Toronto (sixth). On economic indicators, it ranked above Calgary, Toronto, Montreal and Halifax.
The region didn’t rank first on any indicator. It came third out of 14 jurisdictions for venture capital investment per $1 million of GDP, and third out of 19 jurisdictions for port cargo tonnage per $1 million of GDP. Labour productivity and real GDP per capita growth both placed Greater Vancouver fourth on the full list of 20 regions.


