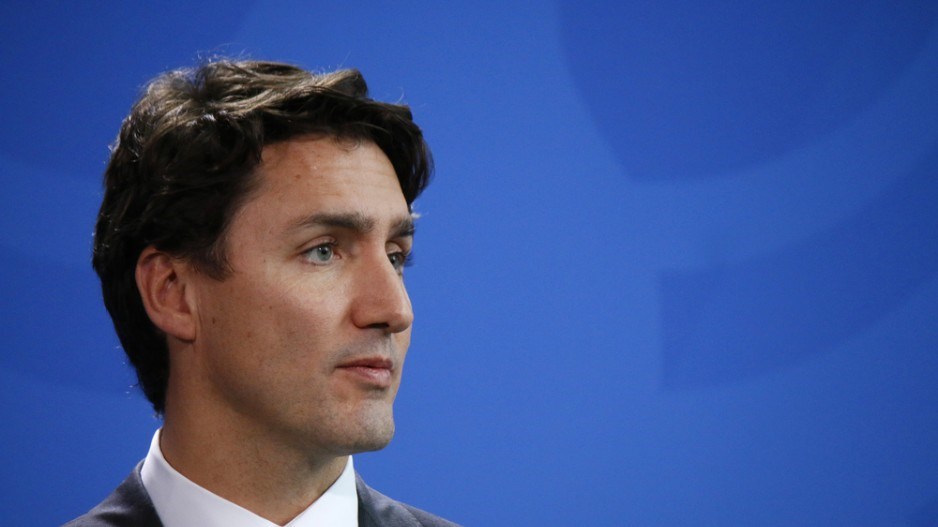
In just over three months, Canadians will take part in a federal election with a very different landscape than in 2015. While the prime minister is a familiar face, two leaders of well-established parties have not been tested in a countrywide campaign. In addition, a new party was assembled by a former Conservative leadership hopeful, and the added emphasis on environmental issues may help the longest-serving party leader in Canada.
The latest Research Co. survey of Canadians suggests that an election held now would probably not yield a majority government. Among decided voters, the governing Liberal Party of Canada is the top choice with 34%, followed closely by the Conservative Party of Canada at 31%, the New Democratic Party (NDP) with 17% and the Green Party of Canada with 10%. The Bloc Québécois and the People’s Party of Canada are in single digits (4% and 3%, respectively).
The Liberals are leading in Atlantic Canada (36%), Quebec (36%) and Ontario (34%) but lag behind in the Prairies. In British Columbia, where the Liberals had their best result since 1968 in the last election, the race is close. The Tories hold a two-point edge over the Grits (31% to 29%), with the NDP at 22% and the Greens at 15%.
There are currently five answers that reach double digits when Canadians are asked what the most important issue facing Canada today is: the economy and jobs (19%), health care (also 19%), the environment (16%), housing, homelessness and poverty (13%) and immigration (11%).
Atlantic Canadians are more likely to point to health care as a concern (32%), Albertans to the economy (35%), Quebecers to the environment (23%) and British Columbians to housing, homelessness and poverty (24%). In Ontario, the race focuses on health care (24%) and the economy and jobs (20%).
When voters are asked to select what will define their vote in the federal election, a similar narrative emerges. One in four Canadians aged 55 and over (25%) and one-third of Atlantic Canadians (34%) say health care will be their main policy decider. Housing is the key platform plank for voters aged 18 to 34 (14%) and British Columbians (20%).
This state of affairs brings challenges for all participants. The approval rating for Justin Trudeau stands at 41% across Canada and tops that in two provinces that matter greatly: Quebec (48%) and British Columbia (43%).
The national approval rating is five points lower (36%) for Andrew Scheer. The Conservative leader does well in the Tory strongholds of Alberta (54%) and Saskatchewan and Manitoba (44%), but his numbers in the two most populous provinces are not fantastic right now: 34% in Ontario and 33% in Quebec.
NDP Leader Jagmeet Singh holds similar numbers to Scheer (35%) but remains a mystery for 23% of Canadians. Singh’s complications are primarily generational. He goes from an approval high of 46% among Canadians aged 18 to 34 to 27% among those aged 55 and over. While 46% of millennials currently approve of Singh, only 17% of them are willing to give the NDP their vote right now.
Elizabeth May of the Greens has the highest approval rating in the country (42%) and the lowest disapproval numbers (34%). For May, the challenge will lie in defining what type of campaign her party will run: seeking candidates in every riding or devoting resources to areas where the party can expect success.
Lastly, almost half of Canadians (48%) disapprove of how Maxime Bernier of the People’s Party has handled his duties – including 56% in his home province of Quebec. The notion of a split in the centre-right vote that would benefit Liberals and New Democrats has not come to fruition. Only 3% of Canadians who voted for the Stephen Harper-led Conservatives in 2015 would cast a ballot for the People’s Party if a candidate runs in their riding.•
Mario Canseco is president of Research Co.
Results are based on an online study conducted from July 15 to July 17, 2019, among 1,000 adults in Canada. The data has been statistically weighted according to Canadian census figures for age, gender and region in Canada. The margin of error – which measures sample variability – is plus or minus 3.1 percentage points, 19 times out of 20.


