

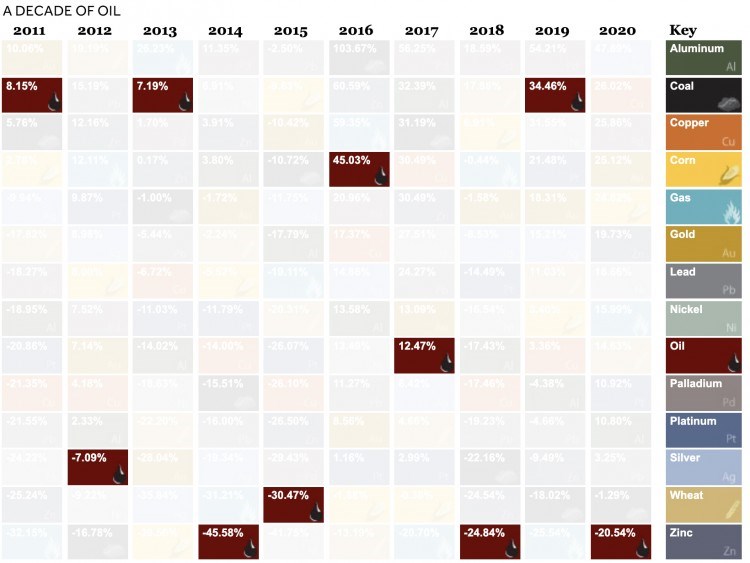
The Periodic Table of Commodity Returns (2011-2020)
Being a commodity investor can feel like riding a roller coaster.
Take silver. Typically known for sharp, idiosyncratic price movements, it faced double-digit declines in the first half of the decade, falling over 35% in just 2013 alone. By contrast, it jumped over 47% in 2020. Similarly, oil, corn, and others witnessed either steep declines or rapid gains.
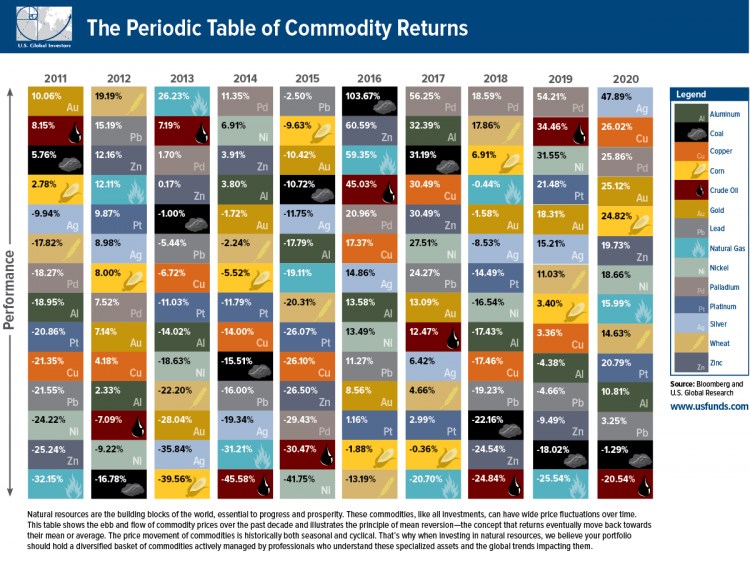
The above graphic from U.S. Global Investors traces 10 years of commodity price performance, highlighting 14 different commodities and their annual ranking over the years.
Commodity Price Performance, From Best to Worst
Which commodities were the top performers in 2020?
The aforementioned silver tripled its returns year-over-year, climbing 47.9% in 2020. In July, the metal actually experienced its strongest month since 1979.
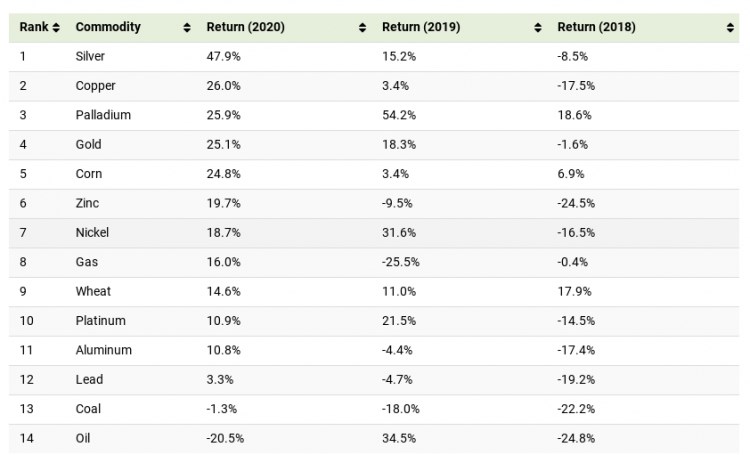
Along with silver, at least seven other commodities had stronger returns than the S&P 500 in 2020, which closed off the year with 16.3% gains. This included copper (26.0%), palladium (25.9%), gold (25.1%) and corn (24.8%).
Interestingly, copper prices moved in an unconventional pattern compared to gold in 2020. Often, investors rush to gold in uncertain economic climates, while sectors such as construction and manufacturing—which both rely heavily on copper—tend to decline. Instead, both copper and gold saw their prices rise in conjunction.
Nowadays, copper is also a vital material in electric vehicles (EVs), with recent demand for EVs also influencing the price of copper.
Silver Linings
As investors flocked to safety, silver’s price reached heights not seen since 2010.
The massive scale of monetary and fiscal stimulus led to inflationary fears, also boosting the price of silver. How does this compare to its returns over the last decade?
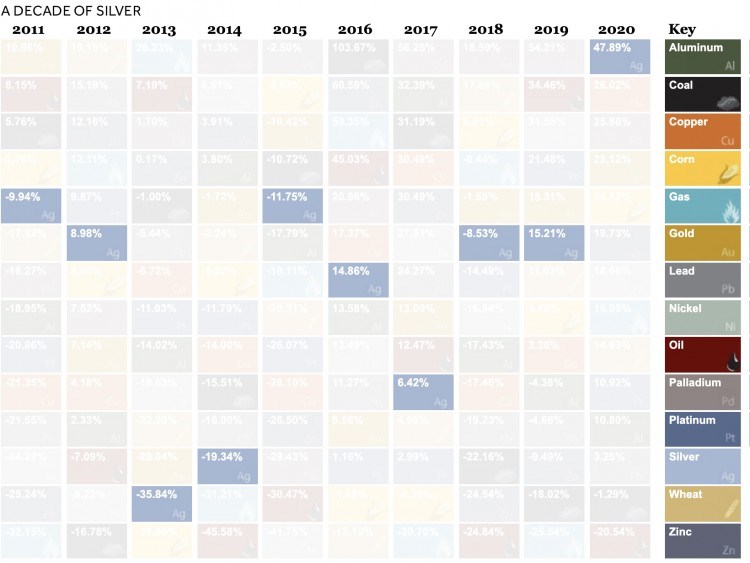
In 2013, silver crashed over 35% as confidence grew in global markets. By contrast, in 2016, the Brexit referendum stirred uncertainty in global markets. Investors allocated money in silver, and prices shifted upwards.
As Gold as the Hills
Like silver, market uncertainty has historically boosted the price of gold.
What else contributed to gold’s rise?
- U.S. debt continues to climb, pushing down confidence in the U.S. dollar
- A weaker U.S. dollar makes gold cheaper for other countries to buy
- Low interest rates kept the returns of other safe haven assets low, making gold more attractive by comparison
Here’s how the price of gold has changed in recent years.
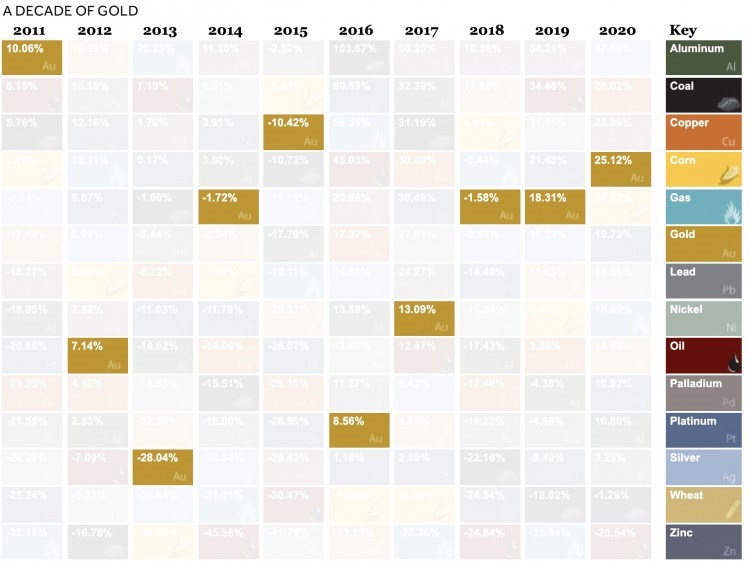
Gold faced its steepest recent declines in 2013, when the Federal Reserve bank discussed tapering down its quantitative easing program in light of economic recovery.
Hitting the Brakes On Oil
Oil suffered the worst commodity price performance in 2020, with -20.5% returns.
For the first time in history, oil prices went negative as demand plummeted. To limit its oversupply, oil producers shrunk investment, closed wells, and turned off valves. Unfortunately, many companies still faced bankruptcies. By November, 45 oil producers had proceeded with bankruptcy filings year-to-date.
This stood in stark contrast to 2019, when prices soared 34.5%.
As is custom for oil, prices see-sawed over the decade. In 2016 and 2019, it witnessed gains of over 30%. However, like 2020, in 2014 it saw huge losses due to an oversupply of global petroleum.
In 2020, total production cuts hit 7.2 million barrels a day in December, equal to 7% of global demand, in response to COVID-19.


