
North America’s West Coast ports weathered Year 1 of the pandemic storm as cargo rebounded late in 2020 after COVID-precipitated supply chain problems caused spring declines.
Vancouver
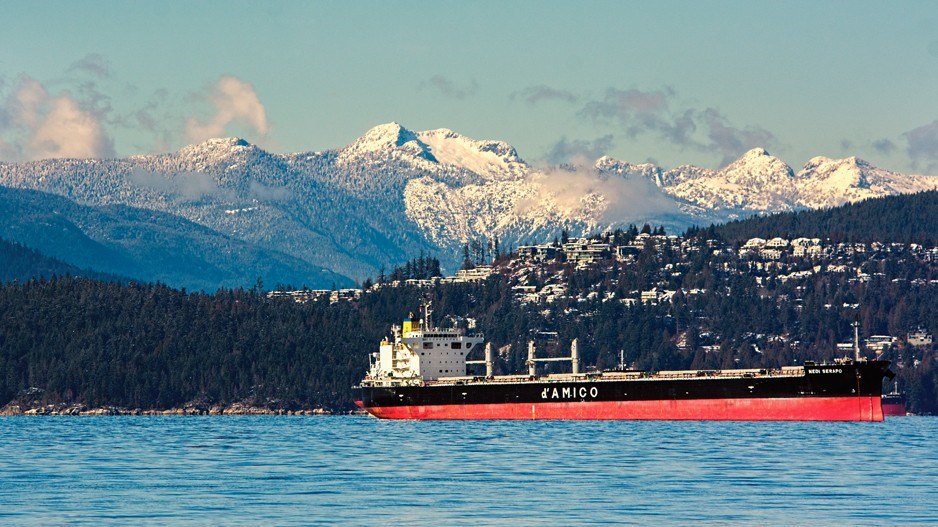
Goods movement through the Port of Vancouver increased a marginal 1% for 2020, a year when global trade was challenged by the COVID-19 pandemic.
Overall, port cargoes increased to 145.5 million tonnes (MMT) in 2020 from 144.2 MMT in 2019. Records were set, however for movement of grain, potash, and containers.
Vancouver Fraser Port Authority president and CEO Robin Silvester said the lesson learned through 2020’s challenges is that continued development of infrastructure is key to growth.
Statistics show, for the fifth year in a row, that global demand for Canadian grain resulted in a new annual record of 35.1 MMT of grain shipped both in bulk ships and containers, an increase of fully 24% or 6.8 MMT compared with 2019.
Shipments of wheat were up by 25%, canola by 45% and specialty crops by 12%.
Growth in total foreign exports resulted in a year-end record of 99 MMT, up 3% due to the increases in grain, fertilizers and petroleum.
Shipping container quantities saw record movement of 3.5 million 20-foot equivalent units (TEUs), an increase of 2% compared with 2019.
However, cargo volumes declined in some sectors. Auto imports were down 18%, and export breakbulk, forest products and coal were down 14% and 15%, respectively, from the previous year.
Prince Rupert
Prince Rupert’s record 32.4 million tonnes of cargo moved in 2020 was 9% higher than the port’s 2019 total, which was 12% more than 2018’s total.
2020’s increased volumes were led by higher exports of coal, propane and wood pellets.
Significant drops were seen in logs, machinery, steel pipe, canola and oats.
Ridley Terminal posted a year-over-year increase of 26%, driven by thermal coal demand.
AltaGas’ (TSX:ALA) Ridley Island Propane Export Terminal marked Year 1 of operation in May 2020, ending the year with 1,159,207 tonnes loaded onto Asia-bound vessels.
Pinnacle Renewable Energy’s (TSX:PL) Westview Terminal exported 1,474,301 tonnes of wood pellets, an increase of 33% over 2019.
However, factory shutdowns in Asia and locked-down North American economies caused a 19% drop in container traffic in 2020’s second quarter.
That said, volumes rebounded, and DP World’s Fairview Container Terminal finished 6% down with 1,141,390 TEUs moved during the year. The decrease is attributed mostly to a decline in the volume of empty containers being shipped back to Asia.
That’s in contrast to 2019, when the terminal moved 1.2 million TEUs, an increase of 17% over 2018.
Seattle-Tacoma
Total TEUs through the ports of Seattle and Tacoma, which make up the Northwest Seaport Alliance (NSA), declined to 3,320,379 in 2020 from 3,775,303 in 2019. Sharp cargo movement declines ran in tandem with the pandemic’s progress March through May, with growth resuming in November.
Overall, international import full TEUs declined 8.4%, international full export TEUs dropped 13.4% and empty containers dropped 23.8%.
Among other cargoes:
•breakbulk rose 18.3%;
•autos fell 20%;
•logs dropped 100%;
•petroleum increased 6.6%; and
•molasses fell 9.1%.
Overall NSA cargo volumes dropped 10.7% to 26,764,655 MT in 2020 from 29,982,608 in 2019.
Portland
After several years of low activity, the bustle is returning to Portland’s docks.
Total tonnage rose to 10.27 MMT in 2020, a jump from 9.69 MMT in 2019.
The port reported no breakbulk tonnage for 2020 as figures slowly declined from 2007’s 1.02 MMT.
Portland’s TEU movements also increased in 2020 to 58.066 MMT from 26 MMT in 2019, but were far from 2003’s 339.57 MMT.
Automobile movements dropped from 341,503 vehicles in 2019 to 261,911 in 2020, well off 2007’s 449,307.
Grain tonnage climbed to 3.37 MMT in 2020 from 1.95 MMT the previous year. That’s down from 4.2 MMT in 2016, which was a rebound after four years of declines from 2011’s 3.29 MMT.
Mineral bulk tonnage had been steadily growing to a peak of 9.1 MMT in 2019 before dropping to 5.9 MMT last year.
Port spokeswoman Susie Rantz said the port has been building business steadily since losing container traffic in 2015. She said the port taking over its Terminal 6 and the addition of BNSF Railway service have combined with other factors to return the Columbia River port to health.
“We’ve proven we can be productive again,” she said.
Los Angeles
Port of Los Angeles statistics show movement of TEUs dropped to 9,213,395 from 9,337,632 in 2019.
The port’s top five containerized imports were furniture, auto parts, apparel, electronics and plastics; top exports were pet/animal feed, paper/wastepaper, soybeans, scrap metal and fabrics/raw cotton.
Port executive director Gene Seroka told the Pacific Merchant Shipping Association in January that a late-year surge of pandemic-induced consumer spending helped boost volumes to near 2019 levels, making 2020 the fourth-highest-volume year in port history.
“Our container business in 2020 was the most erratic we have ever seen, with volumes plunging nearly 19% in the first five months of the year, followed by an unprecedented second-half surge,” Seroka said.
The port said automobile imports dropped to 102,122 from 123,091 while exports were more than halved, to 1,331 from 3,951. Auto parts exports also dropped to 291,756 TEUs from 326,756 in 2019.
Liquid bulk imports through Los Angeles dropped to 51,871,938 barrels in 2020 from 71,950,142 barrels in 2019. Exports also dropped from 23,080,160 to 73,017,182 barrels.
Other cargoes included:
•bulk scrap metal down to 686,435 MT from 849,398 MT ;
•bulk steel imports down to 1,078,816 MT from 1,639,624 MT; and
•bulk fruit imports down to 65,009 MT from 72,084 MT.
The port said it has 40% of West Coast port cargo market share.
Port of Long Beach 2020 stats were unavailable at press time.
Oakland
Oakland posted near-record cargo shipment figures. Some 995,977 full import TEUs rose from 2019’s 975,210, and the port’s 927,799 export TEUs represented a slight drop compared with 2019’s 931,019.
With full and empty TEUs combined, Oakland moved 2.46 million TEUs, a dip from 2019’s 2.5 million.
The port said February was the busiest for imports in its 94-year history and that import volume has risen dramatically since last summer, thanks to increased U.S. consumer spending.
San Francisco results were unavailable. •


