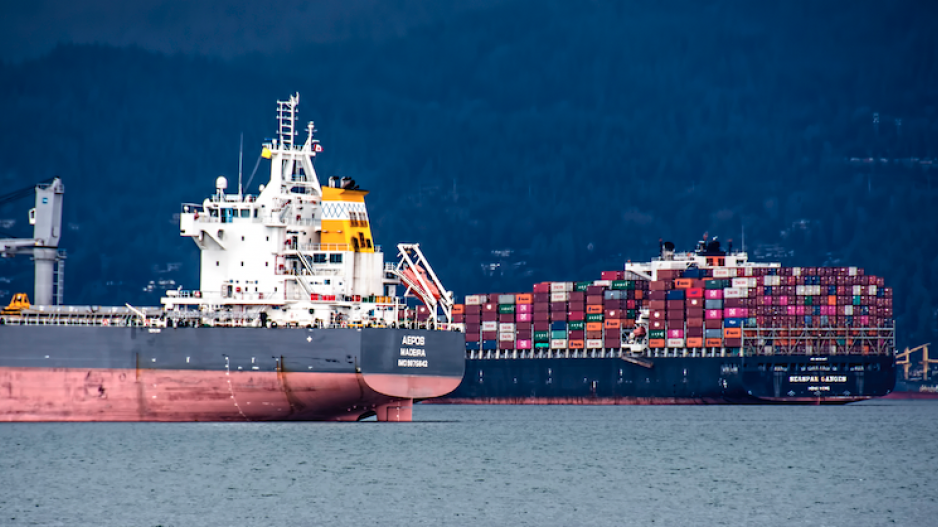
In the world cup of port efficiency, the west coast of North America is hovering around relegation status.
The bad news for the Port of Vancouver is that it is three rungs from the bottom of the container cargo efficiency rankings for 370 of the world’s largest containerized cargo ports; the good news is that it is ahead of the ports of Long Beach and Los Angeles, which ranked 369 and 370, respectively.
A silver lining, yes, but marginally satisfying in an otherwise poor industry showing for B.C.’s ports.
Prince Rupert landed at 344, ahead of Tacoma (345), but behind Seattle (336).
The Container Port Performance Index (CPPI) rankings are part of the second annual measurement of global port efficiency released by the World Bank Group in co-operation with S&P Global Market Intelligence.
The World Bank rankings are based on a number of metrics, but port hours per ship call is the main measurement at work here. Average call and vessel size and comparative port workloads are also factored into the CPPI rankings.
Prior to compilation of the 2020 CPPI, the report’s authors note that the “quality, consistency, and availability of data; the definitions employed; and the capacity and willingness of the organizations to collect and transmit data to a collating body have all precluded the development of” a comparable measurement to assess port performance.
But the report notes that new technologies, increased digitization and the willingness of port and marine shipping interests to improve systemwide performance now provide accurate and reliable port performance measurements.
For North America’s west coast, the poor CPPI performance results are disappointing but not surprising.
Transpacific container ports have been struggling to recover from a sudden and unexpected pandemic-driven spike in consumer goods demand that began in 2020’s second half and has only recently begun to ease along with pandemic restrictions.
As documented previously in BIV, earlier this year, Shifl, a New York-based freight-forwarding company, reported that the average transit times for container ships on the transpacific trade loop had jumped 96 per cent in December 2021 compared with May 2021.
Transit data measures the time it takes for a container to leave its port of origin until it is unloaded at its destination terminal.
That time hit around 54 days for a container to get from the ports of Shanghai, Shenzhen, Hong Kong or Tianjin and to be unloaded in Los Angeles-Long Beach in California. That is 238 per cent higher than the average pre-pandemic transit time of 16 days.
Transit time delays to the ports of Vancouver and Prince Rupert hit anywhere between nine and 12 days during the same period in 2021. Added to the normal container transit time of between 16 and 23 days to B.C.’s two main ports from the same Chinese ports, a container took between 28 and 35 days to get to its destination via B.C.’s West Coast.
However, updated Shifl data released on May 9 showed significant improvement in transpacific transit times to the U.S. West Coast. They dropped to 24 days in April from the 54 recorded in December 2021. Shifl attributed the reduction in transit times to lower freight demand and COVID-19 lockdowns in China and noted that while the improvement is significant, transpacific transit times are still below pre-pandemic levels. It added that some West Coast cargo congestion has shifted to North America’s East Coast.
But transit times to Vancouver and Prince Rupert have continued to show heavy cargo congestion. In March, they reached 53 days to Vancouver and 45 days to Prince Rupert, but eased slightly to 44 and 31 days, respectively, in April.
B.C.’s Asia-Pacific Gateway performance has suffered in part from challenges unique to the province.
While Russia’s invasion of Ukraine and China’s zero-tolerance COVID-19 strategy that has disrupted cargo movement through such major Asian ports as Shanghai and Shenzhen have affected ports all over the world, a massively destructive wildfire season followed by catastrophic flooding in 2021 hammered transportation infrastructure in B.C.
Especially hard hit were rail lines connecting the province’s ports with the rest of the country’s cargo movement network.
That set B.C.’s ports and the rest of the country’s Asia Pacific Gateway back for weeks. Digging out from under the resulting backlog has been a major factor in undermining port and terminal cargo movement performance.
Still, West Coast cargo movement rankings are poor compared with major competitors elsewhere in the world.
Vancouver’s ranking in the previous World Bank port efficiency report, which was based on 2019 data, was 237; Prince Rupert’s was 330.
Atop the 2021 CPPI rankings were Saudi Arabia’s King Abdullah Port and Oman’s Port of Salalah.
[email protected]
@timothyrenshaw


