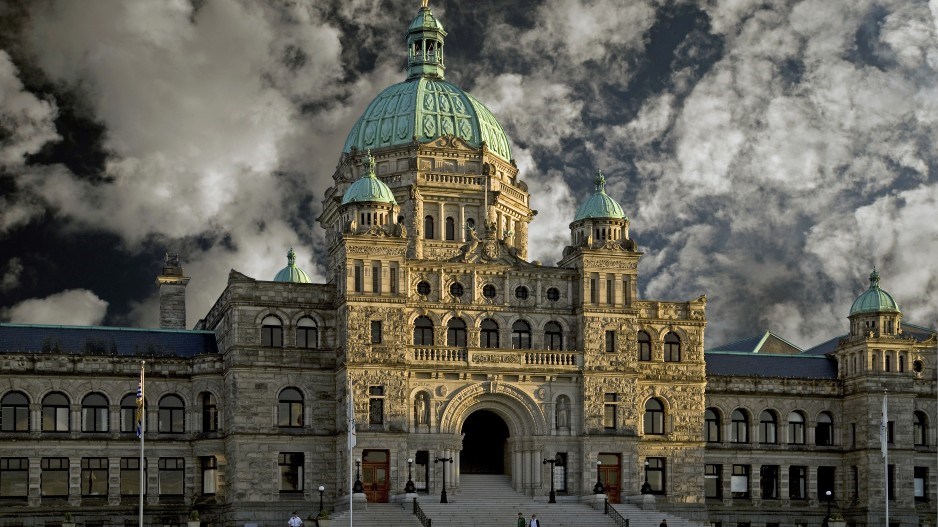
Two years ago, the main political leaders of British Columbia were engaged in discussions related to the formation of the next provincial government after a very close election. In the end, a speech from the throne tabled by the governing BC Liberals was defeated by the Opposition BC New Democratic Party (BC NDP) and three BC Green Party lawmakers. The BC NDP formed the government a few days later.
The next election is tentatively scheduled for October 2021, a change from the May ballots that the province got used to. At what is practically the midway point of this legislature, Research Co. looked at the way the main political leaders are connecting with residents, and which party would get the most votes if an election were held tomorrow.
On the voting question, the BC NDP is first with the backing of 40% of decided voters. This result mirrors the level of support the party received in the 2017 election. The New Democrats continue to connect well with women, as well as voters aged 18 to 34 and 35 to 54.
At this point, 51% of British Columbians approve of the performance of Premier John Horgan. In the party’s key strongholds of Metro Vancouver and Vancouver Island, satisfaction with the premier reaches 55% and 59%, respectively.
The BC Liberals are in second place among decided voters with 30%, down 10 points from their result in the last election. The party remains popular in southern B.C. (39%, with the BC NDP a distant second at 25%).
BC Liberal Leader Andrew Wilkinson has an approval rating of 34%, with 41% of British Columbians disapproving of his performance and 25% saying they are undecided. Three in five voters who supported the BC Liberals in 2017 (63%) voice satisfaction with Wilkinson. This might seem like a high number, but it is lower than the 79% reached by Horgan among those who cast a ballot for BC NDP candidates two years ago.
The BC Greens have improved on their 2017 result by four points, with 21% of decided voters saying they would vote for the Green candidate in their riding. This includes 24% of women and 25% of those aged 18 to 34 – two demographics where the Greens are now tied with the BC Liberals.
Across the province, 42% of residents have a positive opinion of how Andrew Weaver has handled his duties as leader of the BC Greens – a proportion that jumps to 47% among those aged 18 to 34.
Nine per cent of decided voters say they would support the BC Conservative Party if a provincial election took place tomorrow. The party goes into double digits in southern B.C. (14%) and northern B.C. (16%), but two questions need to be answered before a comeback can be staged – one about provincewide presence and another about leader awareness.
When it comes to priorities, 42% of British Columbians say “housing, homelessness and poverty” is the most important issue facing the province today. Residents aged 18 to 34 (49%) and Metro Vancouverites (47%) remain particularly focused on this topic.
Four other issues are gaining some ground in a debate that has been polarized by housing: health care (11%), the economy and jobs (also 11%), the environment (10%) and energy and pipelines (9%). Women and residents aged 55 and over are more likely to mention health care, while the economy and jobs is a bigger concern in northern B.C.
It is also worthwhile to look at the things that are not worrying British Columbians anymore. Accountability, which surpassed double digits in the last months of Gordon Campbell’s tenure, is at 3%. Education, which briefly climbed the charts as the previous government negotiated with teachers, is also at 3%. •
Mario Canseco is president of Research Co.
Results are based on an online study conducted from May 20 to May 22, 2019, among 800 adults in British Columbia. The data has been statistically weighted according to Canadian census figures for age, gender and region in British Columbia. The margin of error, which measures sample variability, is plus or minus 3.5 percentage points, 19 times out of 20.


